Choropleth Map
A choropleth map is a type of thematic map where regions are shaded in proportion to the value of a specific variable. It is useful for illustrating how a measurement varies across different geographic areas, making it easier to see regional differences. It clearly displays spatial distribution and regional patterns and is easy for a general audience to understand. It is especially effective for the comparison between different areas on the same variable. However, choropleth maps may be misleading if areas have significant size differences. Furthermore, they may oversimplify complex data so therefore, careful selection of classification intervals is important to prevent misinterpretation.
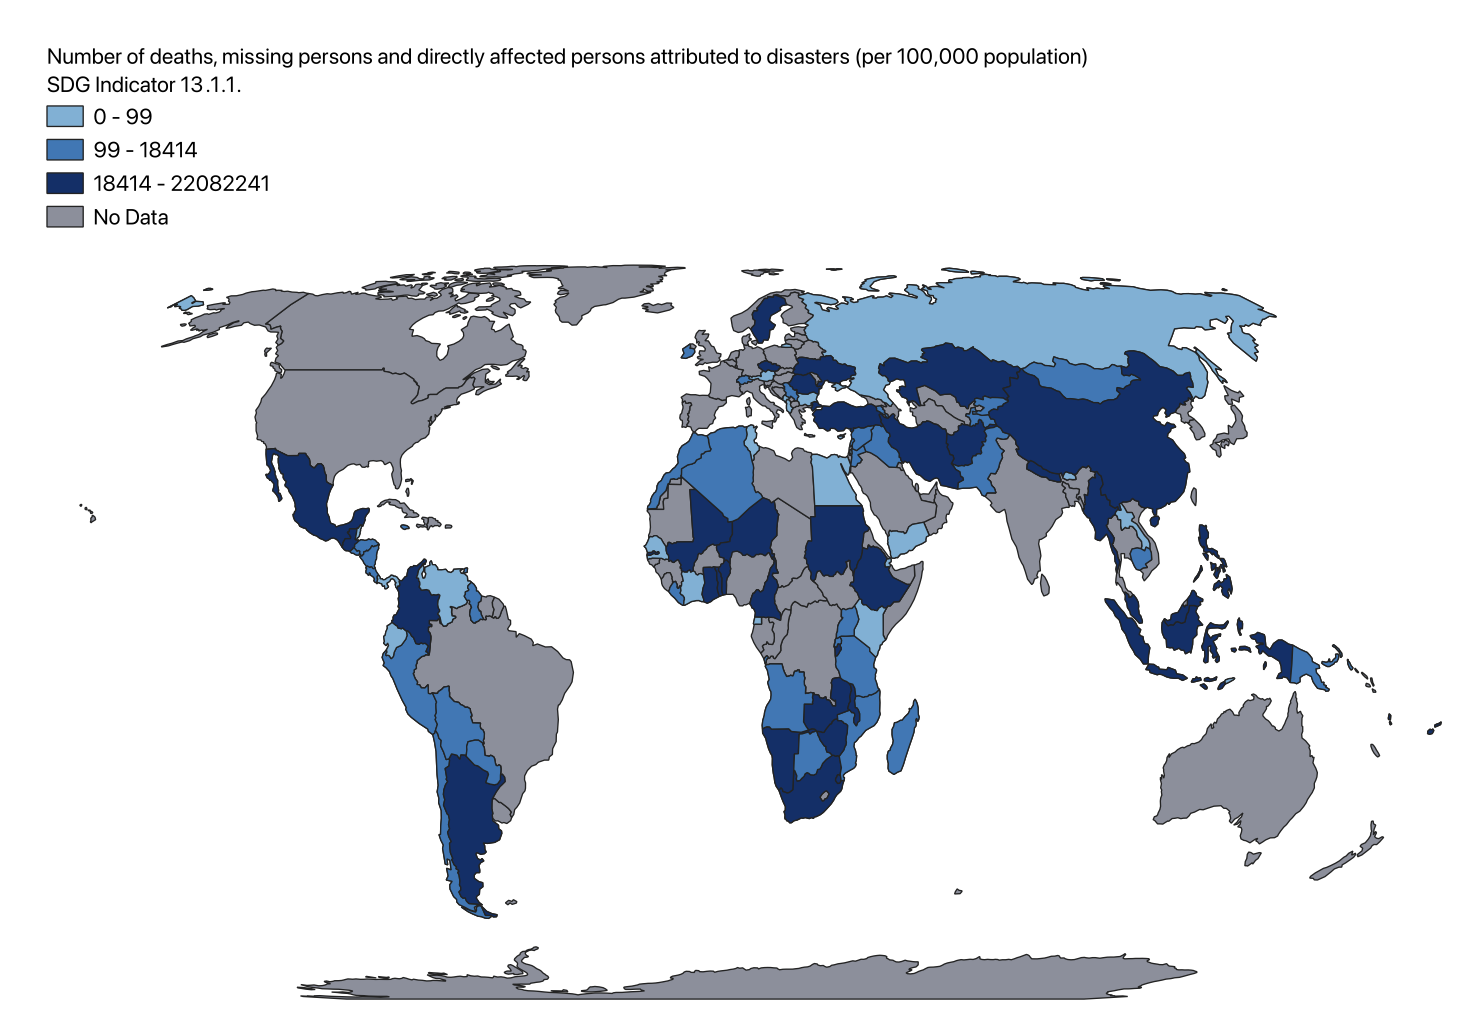
For the comparison of two maps I selected the SDG Indicator 13.1.1, which tracks the number of deaths, missing persons, and those directly affected by disasters per 100,000 population and the SDG 15.1.1, which indicates forest areas a a percentage of total land area. The indicator 13.1.1. highlights the human impact of natural disasters and the effectiveness of disaster risk reduction strategies. I chose this indicator because understanding the effects of disasters is important to mitigate them and especially in the context of climate change this will become more and more important.
Comparing SDG Indicator 13.1.1 (disaster impacts) with SDG Indicator 15.1.1 (forest area percentage) is insightful because it highlights the link between environmental conservation and disaster risk reduction. Indicator 13.1.1 tracks human impacts of natural disasters, which is crucial in the context of climate change. Forests, measured by Indicator 15.1.1, play a vital role in climate regulation and can act as natural barriers against disasters like floods and landslides. Analysing these indicators together can reveal how forest conservation helps reduce disaster impacts, guiding better policies for both environmental health and human safety.
Despite significant missing data in both SDG indicators, the map below clearly shows that areas with higher forest cover percentages tend to experience lower disaster impacts, while regions with less forest cover face greater disaster impacts. This visual connection highlights the role of forests in mitigating natural disasters, suggesting that preserving forest areas can significantly reduce vulnerability and enhance disaster resilience.